NVIDIA GeForce GTX 1660 Ti VS NVIDIA GeForce RTX 2080
nvidia
Brand6GB GDDR6
Memory1536
Cores288 GB/s
BandwidthGeForce GTX 1660 Ti

nvidia
Brand8GB GDDR6
Memory2944
Cores448 GB/s
BandwidthGeForce RTX 2080

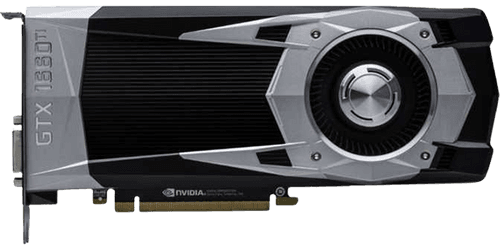
NVIDIA GeForce GTX 1660 Ti
GeForce GTX 1660 Ti
$279 • Feb 2019
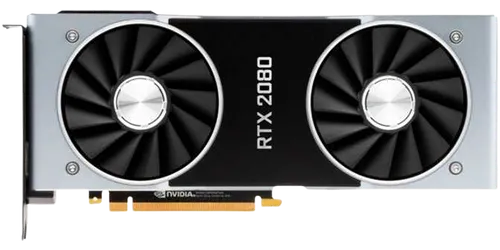
GeForce RTX 2080
$699 • Sep 2018
NVIDIA GeForce RTX 2080

Specs Comparison
| Specification | NVIDIA GeForce GTX 1660 Ti | NVIDIA GeForce RTX 2080 |
|---|---|---|
| Memory Size | 6 GB | 8 GB |
| Memory Type | GDDR6 | GDDR6 |
| TDP | 120 W | 215 W |
| Core Clock | N/A | N/A |
| Boost Clock | 1770 MHz | 1710 MHz |
| Memory Bandwidth | 288 GB/s | 448 GB/s |
| Process Size | 12nm | 12nm |
| Architecture | Turing | Turing |
| Shading Units | 1536 | 2944 |
| RT Cores | N/A | 46 |
| TMUs | 96 | 184 |
| ROPs | 48 | 64 |
| Memory Bus | 192-bit | 256-bit |
| Memory Clock | 1500 MHz | 1750 MHz |
| Pixel Rate | 84.96 GPixel/s | 109.4 GPixel/s |
| Texture Rate | 288 GTexel/s | 448 GTexel/s |
| FP32 Performance | 5.437 GFLOPS | 10.07 GFLOPS |
| L2 Cache | 1.50 MB | 4.00 MB |
| Die Size | 284 mm² | 545 mm² |
| Transistors | 6600 Million | 13600 Million |
| Required PSU | 300 W | 550 W |
| Power Connectors | 1x 8-pin | 1x 6-pin + 1x 8-pin |
| Bus Interface | PCIe 3.0 x16 | PCIe 3.0 x16 |
| DirectX | 12.1 | 12.2 |
| Vulkan | 1.3 | 1.3 |
| OpenGL | 4.6 | 4.6 |
| Foundry | TSMC | TSMC |
Comparison in Synthetic Benchmarks

3DMark Time Spy
Synthetic DirectX 12 benchmark that measures GPU performance in gaming workloads
Graphics Score
NVIDIA GeForce GTX 1660 Ti
NVIDIA GeForce RTX 2080

Geekbench 6
Cross-platform benchmark that measures GPU compute performance using OpenCL and Metal APIs
OpenCL Score
NVIDIA GeForce GTX 1660 Ti
NVIDIA GeForce RTX 2080

GFXBench 5.0
Cross-platform 3D graphics benchmark suite that measures GPU performance across different APIs
Aztec Ruins High (FPS)
NVIDIA GeForce GTX 1660 Ti
NVIDIA GeForce RTX 2080

PassMark G2D
Comprehensive 2D graphics benchmark that measures GPU performance in various graphics operations
G2D Mark
NVIDIA GeForce GTX 1660 Ti
NVIDIA GeForce RTX 2080
Game Benchmarks Comparison (215 benchmarks)


Assassin's Creed Black Flag Resynced


007 First Light


Scars Above


The Forgotten City


The Ascent


Total War ROME REMASTERED
No more benchmarks available for this comparison
NVIDIA GeForce RTX 2080 Wins!
Based on 215 benchmarks across 65 games

NVIDIA GeForce GTX 1660 Ti
NVIDIA • 6GB GDDR6
NVIDIA GeForce RTX 2080
NVIDIA • 8GB GDDR6
Where to Buy

Compare with Similar GPUs


Comments & Discussion
Share your thoughts and experiences