NVIDIA GeForce GTX 1660 Ti VS NVIDIA GeForce GTX TITAN X
nvidia
Brand6GB GDDR6
Memory1536
Cores288 GB/s
BandwidthGeForce GTX 1660 Ti

nvidia
Brand12GB GDDR5
Memory3072
Cores336.6 GB/s
BandwidthGeForce GTX TITAN X
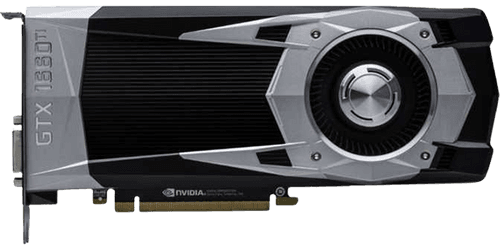
NVIDIA GeForce GTX 1660 Ti
GeForce GTX 1660 Ti
$279 • Feb 2019
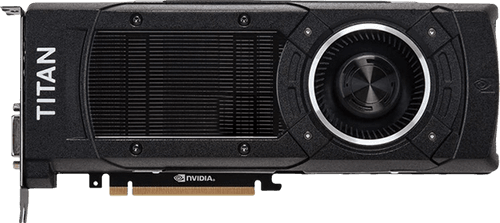
GeForce GTX TITAN X
$999 • Mar 2015
NVIDIA GeForce GTX TITAN X
Specs Comparison
| Specification | NVIDIA GeForce GTX 1660 Ti | NVIDIA GeForce GTX TITAN X |
|---|---|---|
| Memory Size | 6 GB | 12 GB |
| Memory Type | GDDR6 | GDDR5 |
| TDP | 120 W | 250 W |
| Core Clock | N/A | N/A |
| Boost Clock | 1770 MHz | 1089 MHz |
| Memory Bandwidth | 288 GB/s | 336.6 GB/s |
| Process Size | 12nm | 28nm |
| Architecture | Turing | Maxwell 2.0 |
| Shading Units | 1536 | 3072 |
| RT Cores | N/A | N/A |
| TMUs | 96 | 192 |
| ROPs | 48 | 96 |
| Memory Bus | 192-bit | 384-bit |
| Memory Clock | 1500 MHz | 1753 MHz |
| Pixel Rate | 84.96 GPixel/s | 104.5 GPixel/s |
| Texture Rate | 288 GTexel/s | 336.6 GTexel/s |
| FP32 Performance | 5.437 GFLOPS | 6.691 GFLOPS |
| L2 Cache | 1.50 MB | 3.00 MB |
| Die Size | 284 mm² | 601 mm² |
| Transistors | 6600 Million | 8000 Million |
| Required PSU | 300 W | 600 W |
| Power Connectors | 1x 8-pin | 1x 6-pin + 1x 8-pin |
| Bus Interface | PCIe 3.0 x16 | PCIe 3.0 x16 |
| DirectX | 12.1 | 12.1 |
| Vulkan | 1.3 | 1.3 |
| OpenGL | 4.6 | 4.6 |
| Foundry | TSMC | TSMC |
Comparison in Synthetic Benchmarks

3DMark Time Spy
Synthetic DirectX 12 benchmark that measures GPU performance in gaming workloads
Graphics Score
NVIDIA GeForce GTX 1660 Ti
NVIDIA GeForce GTX TITAN X

Geekbench 6
Cross-platform benchmark that measures GPU compute performance using OpenCL and Metal APIs
OpenCL Score
NVIDIA GeForce GTX 1660 Ti
NVIDIA GeForce GTX TITAN X

GFXBench 5.0
Cross-platform 3D graphics benchmark suite that measures GPU performance across different APIs
Aztec Ruins High (FPS)
NVIDIA GeForce GTX 1660 Ti
NVIDIA GeForce GTX TITAN X

PassMark G2D
Comprehensive 2D graphics benchmark that measures GPU performance in various graphics operations
G2D Mark
NVIDIA GeForce GTX 1660 Ti
NVIDIA GeForce GTX TITAN X
Game Benchmarks Comparison
No game benchmarks available for this combination of GPUs yet.
We're working on collecting performance data for this combination of GPUs. Please check back later.
It's a Tie!
Based on 4 synthetic benchmarks

NVIDIA GeForce GTX 1660 Ti
NVIDIA • 6GB GDDR6

NVIDIA GeForce GTX TITAN X
NVIDIA • 12GB GDDR5
Where to Buy

Compare with Similar GPUs


Comments & Discussion
Share your thoughts and experiences