
NVIDIA GeForce GTX 1050 Ti VS NVIDIA GeForce RTX 4080 SUPER
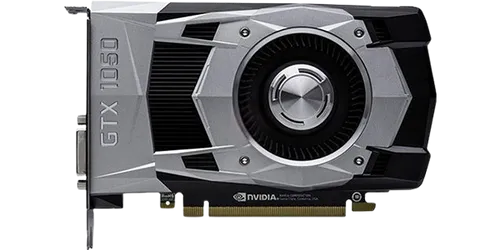
nvidia
Brand4GB GDDR5
Memory768
Cores112.1 GB/s
BandwidthGeForce GTX 1050 Ti

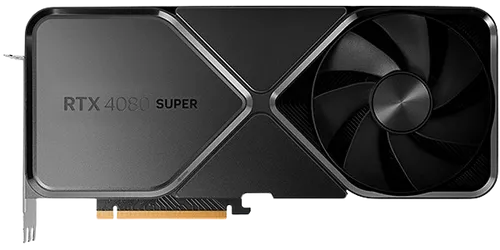
nvidia
Brand16GB GDDR6X
Memory10240
Cores736.3 GB/s
BandwidthGeForce RTX 4080 SUPER
NVIDIA GeForce GTX 1050 Ti
GeForce GTX 1050 Ti
$139 • Oct 2016
GeForce RTX 4080 SUPER
$999 • Jan 2024
NVIDIA GeForce RTX 4080 SUPER
Specs Comparison
| Specification | NVIDIA GeForce GTX 1050 Ti | NVIDIA GeForce RTX 4080 SUPER |
|---|---|---|
| Memory Size | 4 GB | 16 GB |
| Memory Type | GDDR5 | GDDR6X |
| TDP | 75 W | 320 W |
| Core Clock | N/A | N/A |
| Boost Clock | 1392 MHz | 2550 MHz |
| Memory Bandwidth | 112.1 GB/s | 736.3 GB/s |
| Process Size | 14nm | 5nm |
| Architecture | Pascal | Ada Lovelace |
| Shading Units | 768 | 10240 |
| RT Cores | N/A | 80 |
| TMUs | 48 | 320 |
| ROPs | 32 | 112 |
| Memory Bus | 128-bit | 256-bit |
| Memory Clock | 1752 MHz | 1438 MHz |
| Pixel Rate | 44.54 GPixel/s | 285.6 GPixel/s |
| Texture Rate | 112.1 GTexel/s | 736.3 GTexel/s |
| FP32 Performance | 2.138 GFLOPS | 52.22 GFLOPS |
| L2 Cache | 1.00 MB | 64.00 MB |
| Die Size | 132 mm² | 379 mm² |
| Transistors | 3300 Million | 45900 Million |
| Required PSU | 250 W | 700 W |
| Power Connectors | None | 1x 16-pin |
| Bus Interface | PCIe 3.0 x16 | PCIe 4.0 x16 |
| DirectX | 12.1 | 12.2 |
| Vulkan | 1.3 | 1.3 |
| OpenGL | 4.6 | 4.6 |
| Foundry | Samsung | TSMC |
Comparison in Synthetic Benchmarks

3DMark Time Spy
Synthetic DirectX 12 benchmark that measures GPU performance in gaming workloads
Graphics Score
NVIDIA GeForce GTX 1050 Ti
NVIDIA GeForce RTX 4080 SUPER

Geekbench 6
Cross-platform benchmark that measures GPU compute performance using OpenCL and Metal APIs
OpenCL Score
NVIDIA GeForce GTX 1050 Ti
NVIDIA GeForce RTX 4080 SUPER

GFXBench 5.0
Cross-platform 3D graphics benchmark suite that measures GPU performance across different APIs
Aztec Ruins High (FPS)
NVIDIA GeForce GTX 1050 Ti
NVIDIA GeForce RTX 4080 SUPER

PassMark G2D
Comprehensive 2D graphics benchmark that measures GPU performance in various graphics operations
G2D Mark
NVIDIA GeForce GTX 1050 Ti
NVIDIA GeForce RTX 4080 SUPER
Game Benchmarks Comparison
No game benchmarks available for this combination of GPUs yet.
We're working on collecting performance data for this combination of GPUs. Please check back later.
NVIDIA GeForce RTX 4080 SUPER Wins!
Based on 4 synthetic benchmarks
NVIDIA GeForce GTX 1050 Ti
NVIDIA • 4GB GDDR5

NVIDIA GeForce RTX 4080 SUPER
NVIDIA • 16GB GDDR6X
Where to Buy

Compare with Similar GPUs


Comments & Discussion
Share your thoughts and experiences