
nvidia
Brand8GB GDDR6
Memory2560
Cores224 GB/s
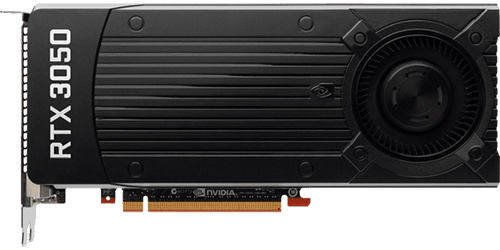
BandwidthNVIDIA GeForce RTX 3050 8 GB
nvidia
Brand8GB GDDR6
Memory2944
Cores448 GB/s
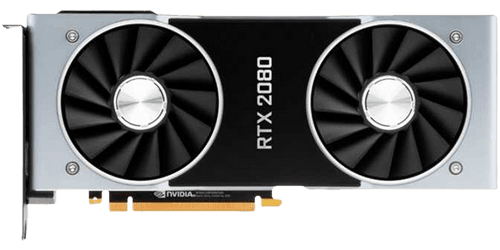
BandwidthNVIDIA GeForce RTX 2080
NVIDIA GeForce RTX 3050 8 GB
GeForce RTX 3050 8 GB
$249 • Jan 2022
GeForce RTX 2080
$699 • Sep 2018
NVIDIA GeForce RTX 2080
Specs Comparison
| Specification | NVIDIA GeForce RTX 3050 8 GB | NVIDIA GeForce RTX 2080 |
|---|---|---|
| Memory Size | 8 GB | 8 GB |
| Memory Type | GDDR6 | GDDR6 |
| TDP | 130 W | 215 W |
| Core Clock | N/A | N/A |
| Boost Clock | 1777 MHz | 1710 MHz |
| Memory Bandwidth | 224 GB/s | 448 GB/s |
| Process Size | 8nm | 12nm |
| Architecture | Ampere | Turing |
| Shading Units | 2560 | 2944 |
| RT Cores | 20 | 46 |
| TMUs | 80 | 184 |
| ROPs | 32 | 64 |
| Memory Bus | 128-bit | 256-bit |
| Memory Clock | 1750 MHz | 1750 MHz |
| Pixel Rate | 56.86 GPixel/s | 109.4 GPixel/s |
| Texture Rate | 224 GTexel/s | 448 GTexel/s |
| FP32 Performance | 9.098 GFLOPS | 10.07 GFLOPS |
| L2 Cache | 2.00 MB | 4.00 MB |
| Die Size | 276 mm² | 545 mm² |
| Transistors | 12000 Million | 13600 Million |
| Required PSU | 300 W | 550 W |
| Power Connectors | 1x 8-pin | 1x 6-pin + 1x 8-pin |
| Bus Interface | PCIe 4.0 x8 | PCIe 3.0 x16 |
| DirectX | 12.2 | 12.2 |
| Vulkan | 1.3 | 1.3 |
| OpenGL | 4.6 | 4.6 |
| Foundry | Samsung | TSMC |
Comparison in Synthetic Benchmarks

3DMark Time Spy
Synthetic DirectX 12 benchmark that measures GPU performance in gaming workloads
Graphics Score
NVIDIA GeForce RTX 3050 8 GB
NVIDIA GeForce RTX 2080

Geekbench 6
Cross-platform benchmark that measures GPU compute performance using OpenCL and Metal APIs
OpenCL Score
NVIDIA GeForce RTX 3050 8 GB
NVIDIA GeForce RTX 2080

GFXBench 5.0
Cross-platform 3D graphics benchmark suite that measures GPU performance across different APIs
Aztec Ruins High (FPS)
NVIDIA GeForce RTX 3050 8 GB
NVIDIA GeForce RTX 2080

PassMark G2D
Comprehensive 2D graphics benchmark that measures GPU performance in various graphics operations
G2D Mark
NVIDIA GeForce RTX 3050 8 GB
NVIDIA GeForce RTX 2080
Game Benchmarks Comparison (12 benchmarks)


UNCHARTED Legacy of Thieves Collection


A Plague Tale Requiem


Dying Light 2 Stay Human


ELDEN RING
NVIDIA GeForce RTX 2080 Wins!
Based on 12 benchmarks across 4 games
NVIDIA GeForce RTX 3050 8 GB
NVIDIA • 8GB GDDR6
NVIDIA GeForce RTX 2080
NVIDIA • 8GB GDDR6
Most Compared GPUs


Comments & Discussion
Share your thoughts and experiences