NVIDIA GeForce GTX 1070 VS NVIDIA TITAN V

nvidia
Brand8GB GDDR5
Memory1920
Cores256.3 GB/s
BandwidthGeForce GTX 1070

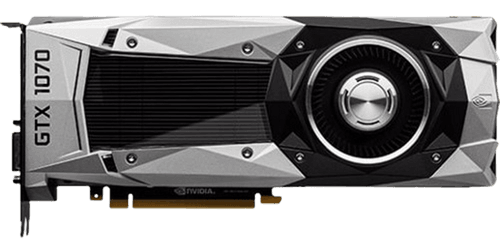
NVIDIA GeForce GTX 1070
GeForce GTX 1070
$379 • Jun 2016
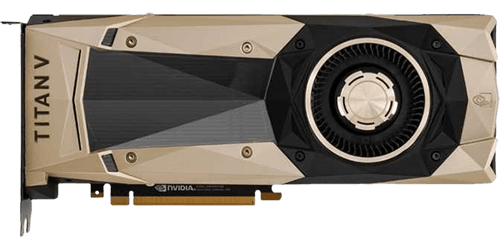
TITAN V
$2999 • Dec 2017
NVIDIA TITAN V

Specs Comparison
| Specification | NVIDIA GeForce GTX 1070 | NVIDIA TITAN V |
|---|---|---|
| Memory Size | 8 GB | 12 GB |
| Memory Type | GDDR5 | HBM2 |
| TDP | 150 W | 250 W |
| Core Clock | N/A | N/A |
| Boost Clock | 1683 MHz | 1455 MHz |
| Memory Bandwidth | 256.3 GB/s | 651.3 GB/s |
| Process Size | 16nm | 12nm |
| Architecture | Pascal | Volta |
| Shading Units | 1920 | 5120 |
| RT Cores | N/A | N/A |
| TMUs | 120 | 320 |
| ROPs | 64 | 96 |
| Memory Bus | 256-bit | 3072-bit |
| Memory Clock | 2002 MHz | 848 MHz |
| Pixel Rate | 107.7 GPixel/s | 139.7 GPixel/s |
| Texture Rate | 256.3 GTexel/s | 651.3 GTexel/s |
| FP32 Performance | 6.463 GFLOPS | 14.9 GFLOPS |
| L2 Cache | 2.00 MB | 4.50 MB |
| Die Size | 314 mm² | 815 mm² |
| Transistors | 7200 Million | 21100 Million |
| Required PSU | 450 W | 600 W |
| Power Connectors | 1x 8-pin | 1x 6-pin + 1x 8-pin |
| Bus Interface | PCIe 3.0 x16 | PCIe 3.0 x16 |
| DirectX | 12.1 | 12.1 |
| Vulkan | 1.3 | 1.3 |
| OpenGL | 4.6 | 4.6 |
| Foundry | TSMC | TSMC |
Comparison in Synthetic Benchmarks

3DMark Time Spy
Synthetic DirectX 12 benchmark that measures GPU performance in gaming workloads
Graphics Score
NVIDIA GeForce GTX 1070
NVIDIA TITAN V

Geekbench 6
Cross-platform benchmark that measures GPU compute performance using OpenCL and Metal APIs
OpenCL Score
NVIDIA GeForce GTX 1070
NVIDIA TITAN V

GFXBench 5.0
Cross-platform 3D graphics benchmark suite that measures GPU performance across different APIs
Aztec Ruins High (FPS)
NVIDIA GeForce GTX 1070
NVIDIA TITAN V

PassMark G2D
Comprehensive 2D graphics benchmark that measures GPU performance in various graphics operations
G2D Mark
NVIDIA GeForce GTX 1070
NVIDIA TITAN V
Game Benchmarks Comparison
No game benchmarks available for this combination of GPUs yet.
We're working on collecting performance data for this combination of GPUs. Please check back later.
NVIDIA TITAN V Wins!
Based on 4 synthetic benchmarks
NVIDIA GeForce GTX 1070
NVIDIA • 8GB GDDR5

NVIDIA TITAN V
NVIDIA • 12GB HBM2
Compare with Similar GPUs


Comments & Discussion
Share your thoughts and experiences